![How to trade forex with $100 [ small cap trading strategy ]](https://thediaryofatrader.com/wp-content/uploads/2020/06/how-to-trade-forex-with-10-196x126.jpg "How to trade forex with $100 [ small cap trading strategy ]")


One of the great things about MetaTrader platforms is that at the bottom of them, they have a tab that says “market.” This is in the terminal, and opens up a marketplace for trading robots that have been vetted by Metaquotes, the parent company of MetaTrader. This isn’t to say that they can prove that they are profitable, just that you are typically going to find safer robots directly through the store. After all, we are talking about software, and that can always come with bad coding, viruses, and the like. However, when buying directly from the marketplace, you can see that there are a multitude of systems. It is because of this that you need to decide what type of trading theory you are trying to take advantage of. Are you trying to trade short-term? Long-term? Specific pairs? Or are you open to just about anything? At the end of the day, there are a lot of questions asked. However, for a fee you can borrow somebody else’s strategy, either renting or buying flat out. This marketplace allows you to try several different strategies, and add them to your trading. By clicking on a strategy that looks interesting, you can read the information around it, and see exactly what it is the author is trying to accomplish. There will be characteristics listed of the strategy, and some of the parameters as well, as you can quite often adjust the system that you’re using. More importantly, there are reviews and that allows you to see what other people experience. Ultimately, the market should gravitate towards more profitable robots, so therefore they tend to be the ones that are the most downloaded. Most of the time, there are also screenshots available, showing you how things have played out.

One of the great features for the MetaTrader platforms is the ability to use Expert Advisors. Expert Advisors, which are also called EAs, robots, and trading robots, are simply algorithms that decide when to take a trade. MetaTrader platforms can import these programs to place trades for the trader, automatically. There are a multitude of trading robots out there to use, and they can be anywhere from free, to several thousand dollars. Another thing that they can do is control the position size of any trade that you enter. So not only will they fire off a signal to buy or sell a currency pair, but they will also position it accordingly. While different EA parameters, trading styles, and quality can be found, the first thing that you should demand out of any trading robot you use is the ability to control the amount of risk taken on any signal given. The beauty of using an EA is that it can trade for you while you are not sitting at the computer. In fact, algorithmic trading has become a major tool in the arsenal of traders around the world. When you look at job postings for major financial firms, computer programming is quite often just as important as any type of trading skill, due to the mechanical nature of so many of the trading systems. The downside to using a trading robot is they need to be connected to the computer and Internet. In other words, if the power goes out, the trading robot won’t be able to help you. If you lose connectivity to your trading account, it will not place trades, or perhaps more importantly - get you out of a trade that has gone the wrong way. Computers can crash, and a multitude of other issues can occur. Because of this, there is still some human interaction needed when using these things. The quality of the individual EA can vary drastically, and not all trading setups have similar results. Some are tailored for specific currency pair, while others are tailored towards specific types of markets, be a trending, non-trending, bearish, bullish, or a multitude of other variables.
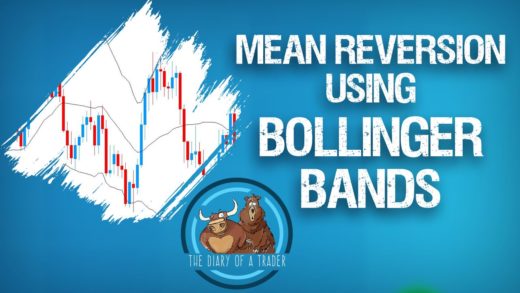
In this video, I look at an indicator called the Bollinger Bands. This is an indicator that uses a moving averages as the “mean” of the market. In other words, it’s where the market “should” be in general. That is the centerline of the 3 lines that plot on the chart. The other 2 are based upon 2 standard deviations from the normal pricing. In statistics, 95% of all distribution in a sample set typically falls within 2 standard deviations, and the Bollinger Bands try to form trading signals based upon this mindset. Looking at the chart, you can see that every time the market gets a bit oversold, and typically will try to reach towards the middle line as we go along. The first couple of trades that I point out in this chart are small ones, because they are oversold and we simply go to the moving average. However, you would’ve known this at a time as the Bollinger Bands were fairly narrow. This means that there isn’t a whole lot of volatility in the marketplace, so we are fairly quiet. If you follow the trend overall, typically you do better. There is a trade on this chart that fired off a buy signal, that didn’t reach the mean until lower prices, which of course would have been a loss. However, it should be noted that we were in a downtrend at that point. Without a doubt, the most common way to trade this market is to simply trying to aim for the norm of the indicator, which of course is the moving average, but some people do try to buy oversold conditions and aim for overbought conditions. Of course, they work in the opposite direction as well but that tends to be the more aggressive and dangerous way to trade this particular indicator. You can make an argument that we do go back and forth eventually, but the “safest” way is to simply look for normalcy. There is an argument to be made that Bollinger Bands need a relatively steady and call market, which makes sense considering we are looking for the norm and not the extreme. It should be noted that this is one of the most well-known trading environment, as it allows you to take a little it’s and pieces of the market as we either continued to climb or fall, going with the trend and has been used for decades in the stock markets.
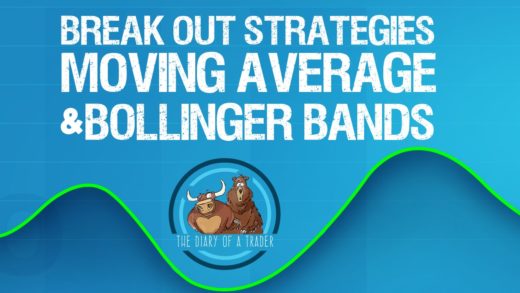
In this video, I’m looking at breakouts using moving averages and Bollinger Bands. In the first chart, I have a 200 day exponential moving average placed upon the GBP/NZD daily chart. You can see clearly that we broke through the 200 day exponential moving average to the downside in December 2015. Recently, we have seen the pair test the bottom of the 200 day exponential moving average and fall. So in this example, you can see where we had an actual break out to the downside as we jumped on the other side of the exponential moving average. It was offering support previously, and then we broke through it. Later, you can see where we did not manage to break out and above the exponential moving average, and that shows that the negativity is still very much a part of this market. In the AUD/JPY one-hour chart, you can see that I have the Bollinger Bands printed on the chart. Notice that the spread of the indicator was very tight, and then we shot straight through the roof and above the overbought indicator. While this typically means that you are looking to sell, when the Bollinger bands are very tight it means that volatility has all but died. Sooner or later inertia will kick in and we have to move in one direction or the other. So having said that, once we broke out to the upside it shows that the buyers are starting to take control. Later on, we ended up falling back to and eventually through the mean (middle line) of the Bollinger Bands, and it means that the explosive move to the upside was indeed over. While these are 2 totally different techniques, they both are used quite extensively by the trading community. Because of this, you should be aware of these potential tools that are available to you.
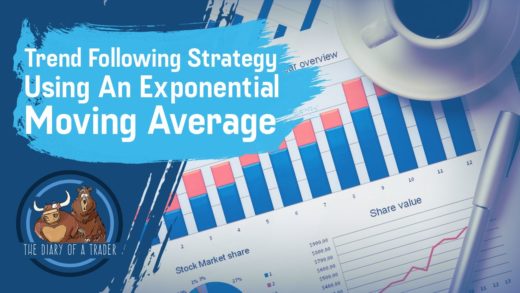
Trend following can be done in several there are ways, but in this video I am looking at the exponential moving average. The difference between the exponential moving average and a simple moving average is that the exponential moving average puts more emphasis on the most recent candles. So for example, if you have a 50 day moving average, the 50-day exponential version of that moving average calculates the most recent candles as much more important than the first few. In other words, and gives you an idea of momentum shifting rather quickly. On the chart, you can see that the 50 day exponential moving average has been offering a bit of dynamic resistance as of late, so traders would expect sellers to come in every time we approach this moving average. Also, you can clearly see that the moving averages moving downward, which of course indicates a negative trend. By using this moving average, the trader would then be able to place trades in the direction of the larger trend in general. Typically, this is the best way to make money in the markets as you are not finding the market but rather letting it work for you. In reality, there isn’t a huge difference between a simple moving average in an exponential moving average though, because quite frankly the calculation isn’t dramatically different on larger timeframe. However, a shorter-term chart you can often see a significant difference as the moving averages will be reacting much quicker.
Any system that you’re going to use to trade the financial markets will have to have some type of rule for entering the market. That being the case, the market needs to tell you when it’s time to go either long or short according to your system. You have to have some type of reason or at least set of rules to start entering the market. One of the biggest killers of trading accounts for new traders is not having any set rules. Depending on when you enter the market can greatly influence whether or not you make money, or at least the amount of money that you make. It can also influence whether or not you lose money, which of course is something that you should try to avoid at all costs. You have to be able to justify entering a trade if you are going to be profitable. After all, you have the ability to enter the market pre-much anytime you want, so having said that you have to be careful and avoid the temptation of just jumping into the market. Unfortunately, there are a lot of traders out there who feel that staying out of the market means that you can’t make any money. While that is true in theory, the reality is that it’s easy to lose money if you are not careful. After all, you have to have a trading plan and system in order to be a professional trader as losses will, even under the best of circumstances. By knowing when to enter the trade, you can avoid a lot of trouble. The system or entry signal that you choose the use is entirely up to you and should only be applied after diligent study. Understand that the market never “has to do” what it’s “supposed to do”, but if you understand the risks ahead, and learn to recognize when it’s time to get involved, you can greatly increase your chances of making money.
One of the things that can supercharge your returns is “going in for the kill.” What I mean by this is adding to your positions as they work out. Far too many traders are afraid to have a position run for a longer period of time and want to take profits as soon as possible. However, if you learn to add to winners, you can pad your account with large gains, and allow for several losses as you occur them. Remember, you are looking to make money in the long term, not just the occasional smash and grab situation. By adding to your winners, you can buy yourself a lot of losers. I mean by this is that if you have a 10% gain in one trade, and a couple of 1% losses after that, you are still making money. The easiest way to compound your account is to add to what’s already working. Obviously, you need a trend to follow at that point, but there are plenty of trending markets in the Forex world at any given moment. In fact, that’s one of the things that makes Forex so attractive, the ability for markets to trend for years at a time. When you are in a trend and get a slight pullback, it makes sense that it’s possible we are going to see a bit of value chased. On those dips, add slightly. By doing that multiple times, you your gains when you have things working in your favor. Obviously, you should never add to a loser, which unfortunately is what a lot of retail traders will do, in the hope of earning back some of their losses when the market turns around. That is the quickest way to ruin, because it supercharges your losses. Do not be afraid to add to your winners, it separates the long-term winners from the rest of the crowd.

When a new trader enters the financial markets, it makes a lot of sense that they would go on to forums and search out information. They will also go to other websites, and perhaps look at technical analysis and seek out the help of so-called “gurus.” This leads to a phenomenon known as “system hopping”, hopefully something that you will spend little to no time involved with. System hopping when you first start trading is natural, because you are seeking out the best route to take going forward. Obviously, when you start a new endeavor, it makes sense that you would search around for the best way to go about it. It’s very easy to be convinced that somebody knows more than you, because you feel that you don’t know much. While this may or may not be true, that doesn’t mean that the other person is correct. Even if they are, it doesn’t mean that they are correct 100% of the time. Therein lies the rub, new traders are looking for the impossible, the Holy Grail of trading. It’s very typical to see a trader attempt a few trades using a system, taking a loss or 2, and then moving on to the next one. Unfortunately, they don’t give the system time to prove itself. Even worse, they do it with a live money instead of a demo account, because they are in a rush to become wealthy. I believe this is mainly driven by the “get rich quick” attitude of most advertising in the financial world. They are on to the next system before the original one has had a fair opportunity to prove itself. The reality is that most systems that are out there have the opportunity to make you money, but you need to give them the chance to do so. A perfect example is the moving average crossover system, something that a lot of people don’t like. However, over the longer term it does tend to make money. That’s the reason it’s been around for so many decades. It takes a trending market, and markets don’t necessarily trend all the time, but the gains far outweigh the losses longer term. However, most traders simply do not have the wherewithal to let the statistical advantage work itself out. They are already on to the next best thing, at least for the next few trades.
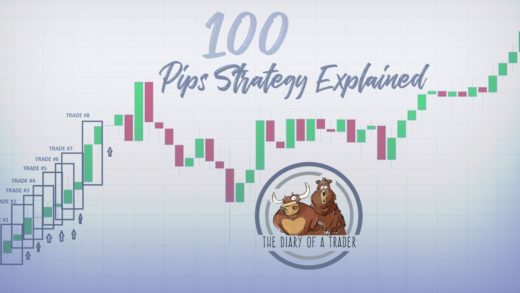
Oddly enough, people seem to be attracted to large, round, psychologically significant numbers. This can break down into several different increments, but for this example we will use 100 pips. Longer-term traders can also look at 500 pips, 250 pips, etc. Looking at the attached USD/CAD hourly chart, you can see that the market does tend to react to large, round, psychologically important numbers such as the 1.27 level, the 1.26 level, and so on. That is exactly what this system exploits: the proclivity of large funds to use large, round, psychologically significant numbers to enter into the market as they have huge amounts of positions to deploy. Also, the options market has a massive effect on how the spot market will move, and that is reflected in the large, round numbers as options are normally priced at them. As you can see, I also have a moving average attached to the chart, and we had an impulsive candle during 1 August that broke above the 1.25 level as the moving average shot higher. That impulsive candle led the market towards the 1.26 level where we pulled back. The trader simply enters the market at the close of the candle, puts a stop loss underneath the large, round, significant number that we have just broken, and the names for the next one. It really is that simple, and if we have any type of trend going, it does work over time.

One of the most recent developments in the trading world is the concept of social trading. Initially, this was found mainly in the currency trading world, but has been adopted by stock traders and commodity traders as well. Essentially, social trading is a place where traders will post their trading ideas, and go back and forth with each other on potential trades. Some places will do it automatically, meaning that there is some type of software that you plug into your trading platform to automatically post positions, while others will rely on you to input your trade. In theory, this is a great idea. However, in practice it is much different. Most people who look at social trading are looking for someone to make their trades for them. In other words, they are waiting for someone to tell them what to do. Typically, what happens is that the new trader will see somebody in the rankings that has made an astronomical return over the last couple of weeks. However, by the time that person gets that high up on the leaderboard, they almost always turn around and fall hard. You will see things like 400% gains in a week, followed by somebody being wiped out. This is because they do not understand leverage, and the new traders that follow them will suffer the same fate.


Recent Comments
Alberto CannApril 19, 2020 at 5:42 pm
thediaryofatraderNovember 26, 2018 at 2:46 am
Forex Steam SettingNovember 26, 2018 at 12:33 am