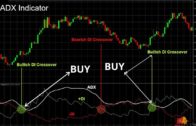
The ADX, also known as the Average Directional Movement Index, is an indicator that Forex traders will use in order to measure the strength of a trend. It represents the average of price ranges that are expanding or contracting. It shows a line that moves up and down with several levels on a window at the bottom of the chart underneath the price graph. It measures the strength of the movement but does not define the direction of the movement. It measures strength using a basic scale.
What ADX Indicator measures
The Average Directional Movement Index measures the moving average of expansion of price during a specific amount of candles. The default setting for this indicator is 14 candles, and that will be by far the largest amount of examples that you will see out there in technical analysis. The indicator has no directionality building, it simply measures whether or not a trend is strengthening or weakening. It will show a single line that goes up and down between the 0 level and the 100 level. It will measure higher levels based upon price expanding over the last set amount of candles. It will also start to drift lower if the price expansion moving average is getting lower over the same set of candlesticks.
It should be noted that there are also +DI and -DI lines on the chart that are calculated, but quite frankly most Forex traders completely ignore them. This is based upon a larger trading system that Bill Williams used to use, so therefore unless you are trying to trade that specific trading system, you will simply ignore those.
What it means
In order to read the ADX, you need to understand that there are certain levels that people pay the most attention to. For example, if the reading is below 25, it tends to mean that there is a weak or nonexistent trend. If the ADX is between 25 and 50, it is considered to be a strong trend, while between 50 and 75 is a very strong trend. Above 75 to the 100 reading is the strongest of all trends.
By looking at the number that the ADX is flashing, it can verify whether or not we are trending, and perhaps more importantly whether or not a specific trait up makes sense. The ADX is in the secondary part of a trade for most traders, as they are looking for candlestick setups or some other such reason to get into the trade, with the ADX confirming whether or not the market is starting to pick up momentum. If you can find a decent set up that also called site quite nicely with a strong ADX reading, it only gives you more of a reason to be involved.
Let profits run? Or heed warning?
The great thing about the ADX is that if you are already in a trend and have already placed your trade, it can give you a bit of a “heads up” if the momentum is slowing down. If they are not, then you simply let your profits continue to run, one of the best ways to make money in the market. However, if the ADX starts to dip lower in your trade, then it can give you an idea that it may be time to start thinking about taking your profit.
Furthermore, there is also the possibility of divergence, meaning that as price moves in one direction, the ADX moves in the other. Because of this, it shows that perhaps although price is moving in a specific direction, there is no real conviction behind the trade, showing what is known as “divergence” by most traders. This is true with all oscillators, but ADX tends to be one of the better ones for this type of trading.


 Difference Between Hammer and Hanging Man 2023 [ Must Watch for Trader ]